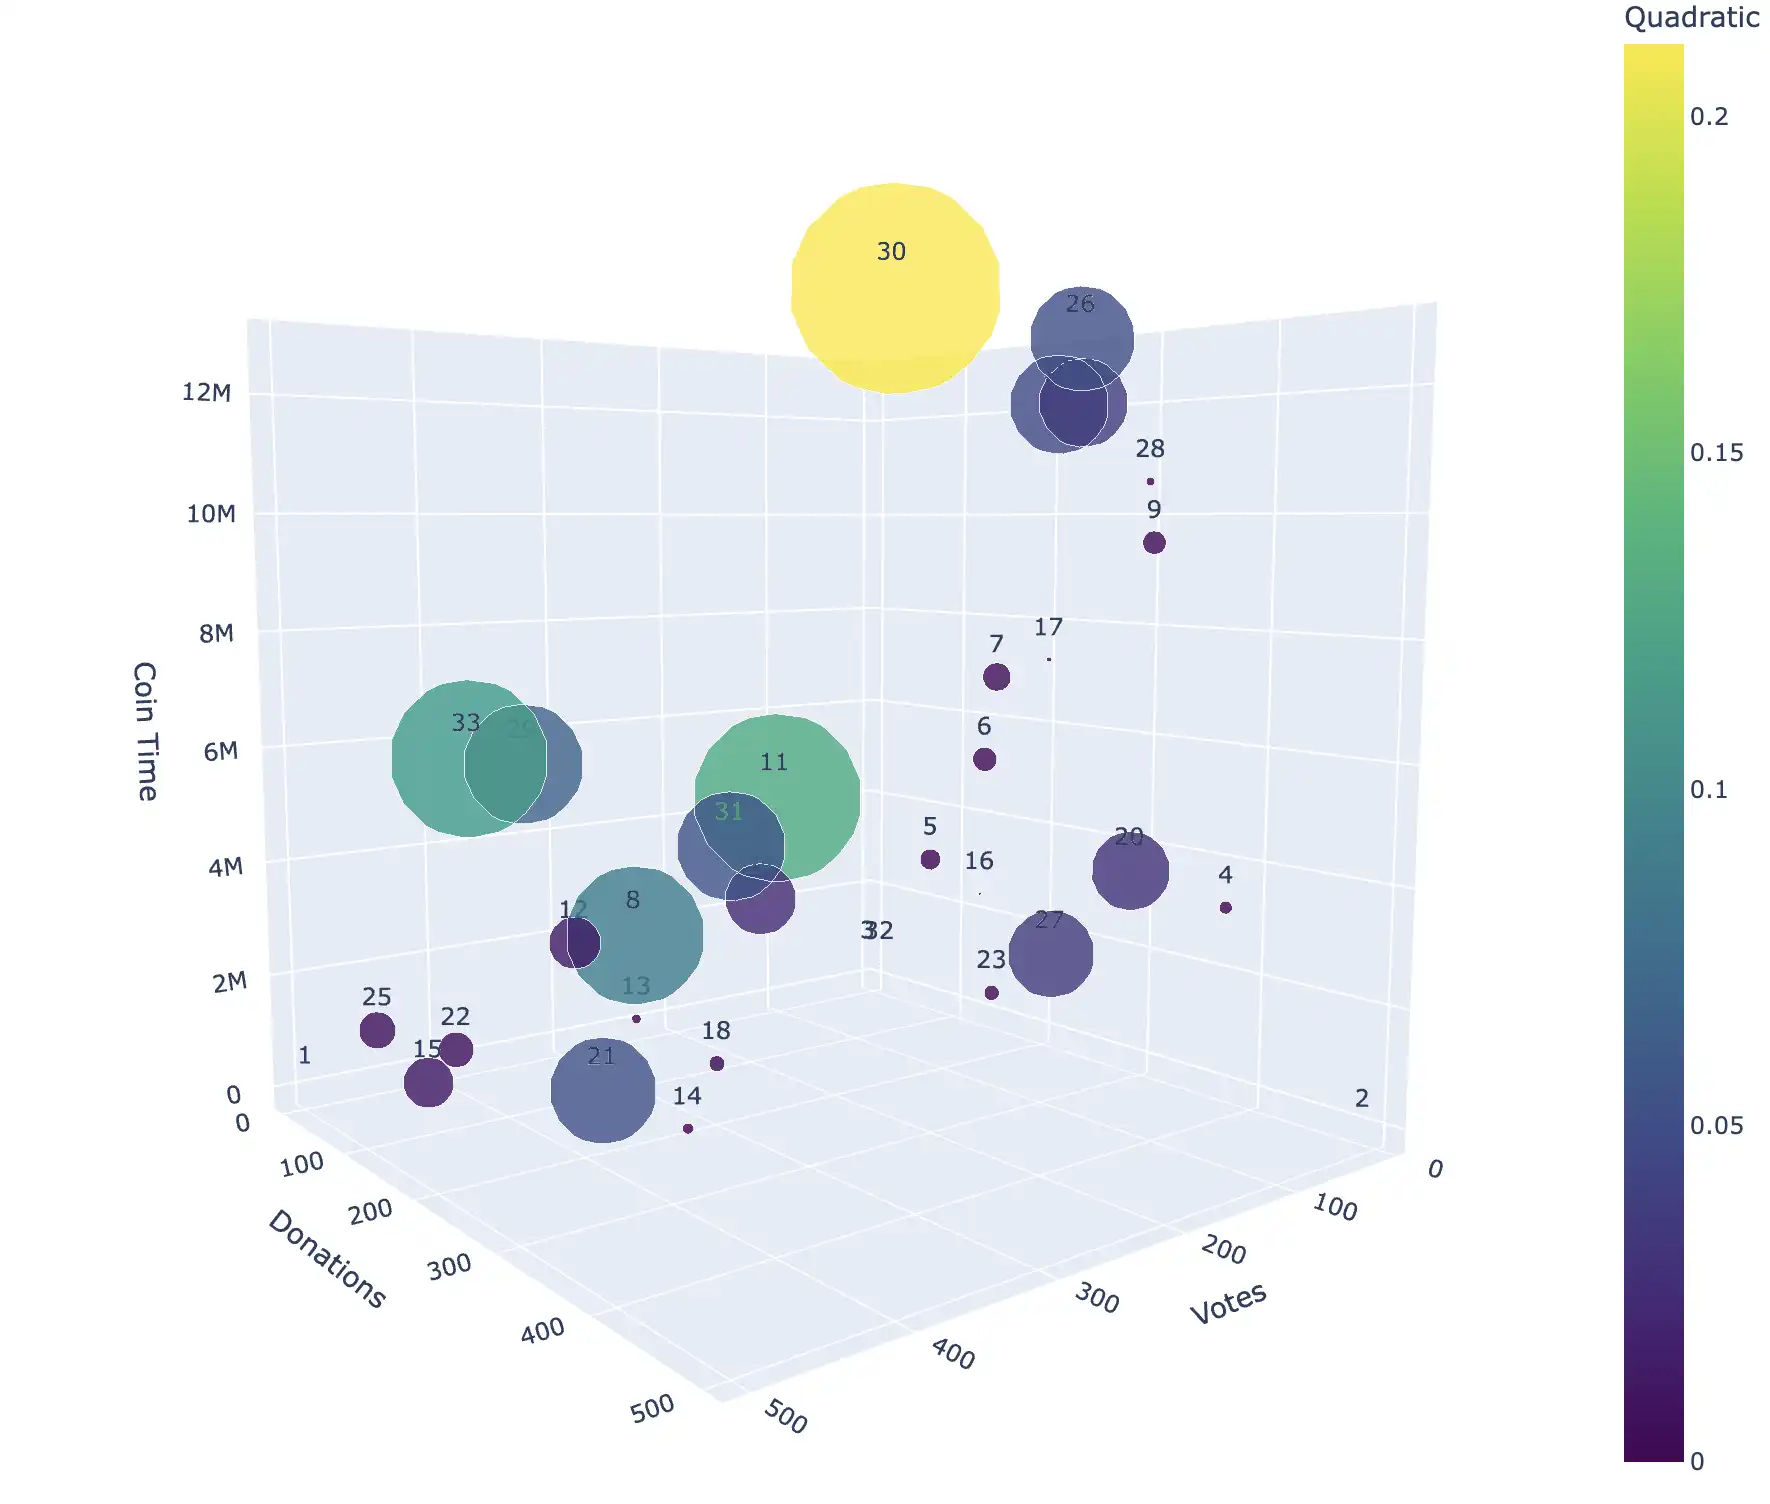
I had an idea for calculating a matching fund distribution based on votes, donations and coin time that doesn't necessarily require smart contracts:
::embed[/skylar/zpage/rfc-a-novel-variant-of-quadratic-funding-without-smart-contracts]To really understand how different variants might work, we really need to simulate some data, visualize, and analyze to understand how it would reward different projects in different scenarios.
Let's compare how different matching allocation formulas would work. Here I'll talk through it since static images and written words might not be too clear.
If you want to try it yourself, this isn't the prettiest code but it gets the job done:
import numpy as npimport pandas as pdimport plotly.express as px # Parametersnum_projects = 33max_votes = 500max_donations = 500max_ct = 34560 np.random.seed(33) # For reproducibility # Generate projects with extreme cases and random data for the restprojects = [ (max_votes, 1, 1), # 1 ZEC at the last block, but big vote campaign (15, max_donations, max_donations), # 500 ZEC on the last block (15, 10, 10 * max_ct), # 1 ZEC for the whole duration] for _ in range(num_projects - 3): votes = np.random.randint(0, max_votes + 1) donations = np.random.randint(0, max_donations + 1) coin_time = np.random.randint(0, donations * max_ct + 1) if donations > 0 else 0 projects.append((votes, donations, coin_time)) # Define matching score functionsdef matching_score_sqrt_no_ct(votes, donations, coin_time): return (votes**(4./5) * np.sqrt(donations)) ** 2 def matching_score_sqrt(votes, donations, coin_time): return (votes**(4./5) * np.sqrt(donations)) ** 2 * np.sqrt(coin_time) def matching_score_votes(votes, donations, coin_time): return votes def matching_score_donations(votes, donations, coin_time): return donations def matching_score_ct(votes, donations, coin_time): return coin_time def matching_score_even_normalized(votes, donations, coin_time, total_votes, total_donations, total_coin_time): votes_normalized = votes / total_votes if total_votes > 0 else 0 donations_normalized = donations / total_donations if total_donations > 0 else 0 coin_time_normalized = coin_time / total_coin_time if total_coin_time > 0 else 0 return (votes_normalized + donations_normalized + coin_time_normalized) / 3 # Calculate total votes, donations, and coin timetotal_votes = sum(v for v, d, ct in projects)total_donations = sum(d for v, d, ct in projects)total_coin_time = sum(ct for v, d, ct in projects) # Calculate matching scores for each strategymatching_scores_sqrt_no_ct = [matching_score_sqrt_no_ct(v, d, ct) for v, d, ct in projects]matching_scores_sqrt = [matching_score_sqrt(v, d, ct) for v, d, ct in projects]matching_scores_votes = [matching_score_votes(v, d, ct) for v, d, ct in projects]matching_scores_donations = [matching_score_donations(v, d, ct) for v, d, ct in projects]matching_scores_ct = [matching_score_ct(v, d, ct) for v, d, ct in projects]matching_scores_even_normalized = [ matching_score_even_normalized(v, d, ct, total_votes, total_donations, total_coin_time) for v, d, ct in projects] # Create a compact dataframedata = { "Project": range(1, num_projects + 1), "Votes": [v for v, d, ct in projects], "Donations": [d for v, d, ct in projects], "Coin Time": [ct for v, d, ct in projects], "Portion (votes)": [float(ms / total_votes) for ms in matching_scores_votes], "Portion (donations)": [float(ms / total_donations) for ms in matching_scores_donations], "Portion (coin time)": [float(ms / total_coin_time) for ms in matching_scores_ct], "Portion (even weighting)": [float(ms) for ms in matching_scores_even_normalized], "Quadratic No CT": [float(ms / sum(matching_scores_sqrt_no_ct)) for ms in matching_scores_sqrt_no_ct], "Quadratic": [float(ms / sum(matching_scores_sqrt)) for ms in matching_scores_sqrt],} df = pd.DataFrame(data) # Combine all proportions to find the maximum value for scalingall_proportions = pd.concat([ df["Portion (votes)"], df["Portion (donations)"], df["Portion (coin time)"], df["Portion (even weighting)"], df["Quadratic No CT"], df["Quadratic"]]) # Calculate sizerefmax_proportion = all_proportions.max()desired_max_size = 250sizeref = float(2. * max_proportion / (desired_max_size ** 2)) # Create 3D scatter plots for each strategyfig_even = px.scatter_3d(df, x="Votes", y="Donations", z="Coin Time", size=df["Portion (even weighting)"], color=df["Portion (even weighting)"], text=df["Project"], title="Even Weighting", labels={"color": "Matching Proportion"}, size_max=desired_max_size, color_continuous_scale=px.colors.sequential.Viridis )fig_even.update_traces(marker=dict(sizemode='area', sizeref=sizeref, opacity=0.8)) fig_sqrt_no_ct = px.scatter_3d(df, x="Votes", y="Donations", z="Coin Time", size=df["Quadratic No CT"], color=df["Quadratic No CT"], text=df["Project"], title="Quadratic No CT", labels={"color": "Matching Proportion"}, size_max=desired_max_size, color_continuous_scale=px.colors.sequential.Viridis )fig_sqrt_no_ct.update_traces(marker=dict(sizemode='area', sizeref=sizeref, opacity=0.8)) fig_sqrt = px.scatter_3d(df, x="Votes", y="Donations", z="Coin Time", size=df["Quadratic"], color=df["Quadratic"], text=df["Project"], title="Quadratic", labels={"color": "Matching Proportion"}, size_max=desired_max_size, color_continuous_scale=px.colors.sequential.Viridis )fig_sqrt.update_traces(marker=dict(sizemode='area', sizeref=sizeref, opacity=0.8)) fig_votes = px.scatter_3d(df, x="Votes", y="Donations", z="Coin Time", size=df["Portion (votes)"], color=df["Portion (votes)"], text=df["Project"], title="Votes Weighting", labels={"color": "Matching Proportion"}, size_max=desired_max_size, color_continuous_scale=px.colors.sequential.Viridis )fig_votes.update_traces(marker=dict(sizemode='area', sizeref=sizeref, opacity=0.8)) fig_donations = px.scatter_3d(df, x="Votes", y="Donations", z="Coin Time", size=df["Portion (donations)"], color=df["Portion (donations)"], text=df["Project"], title="Donations Weighting", labels={"color": "Matching Proportion"}, size_max=desired_max_size, color_continuous_scale=px.colors.sequential.Viridis )fig_donations.update_traces(marker=dict(sizemode='area', sizeref=sizeref, opacity=0.8)) fig_ct = px.scatter_3d(df, x="Votes", y="Donations", z="Coin Time", size=df["Portion (coin time)"], color=df["Portion (coin time)"], text=df["Project"], title="Coin Time Weighting", labels={"color": "Matching Proportion"}, size_max=desired_max_size, color_continuous_scale=px.colors.sequential.Viridis )fig_ct.update_traces(marker=dict(sizemode='area', sizeref=sizeref, opacity=0.8)) # Show the plots fig_votes.show()fig_donations.show()fig_ct.show()fig_even.show()fig_sqrt_no_ct.show()fig_sqrt.show()