A **data dashboard **is the most efficient way to track multiple data sources because it provides a central location for businesses to monitor and analyze performance. Real-time monitoring reduces the hours of analyzing and long line of communication that previously challenged businesses. Behind the scenes, a dashboard connects to your files, attachments, services and API’s, but on the surface displays all this data in the form of tables, line charts, bar charts and gauges.
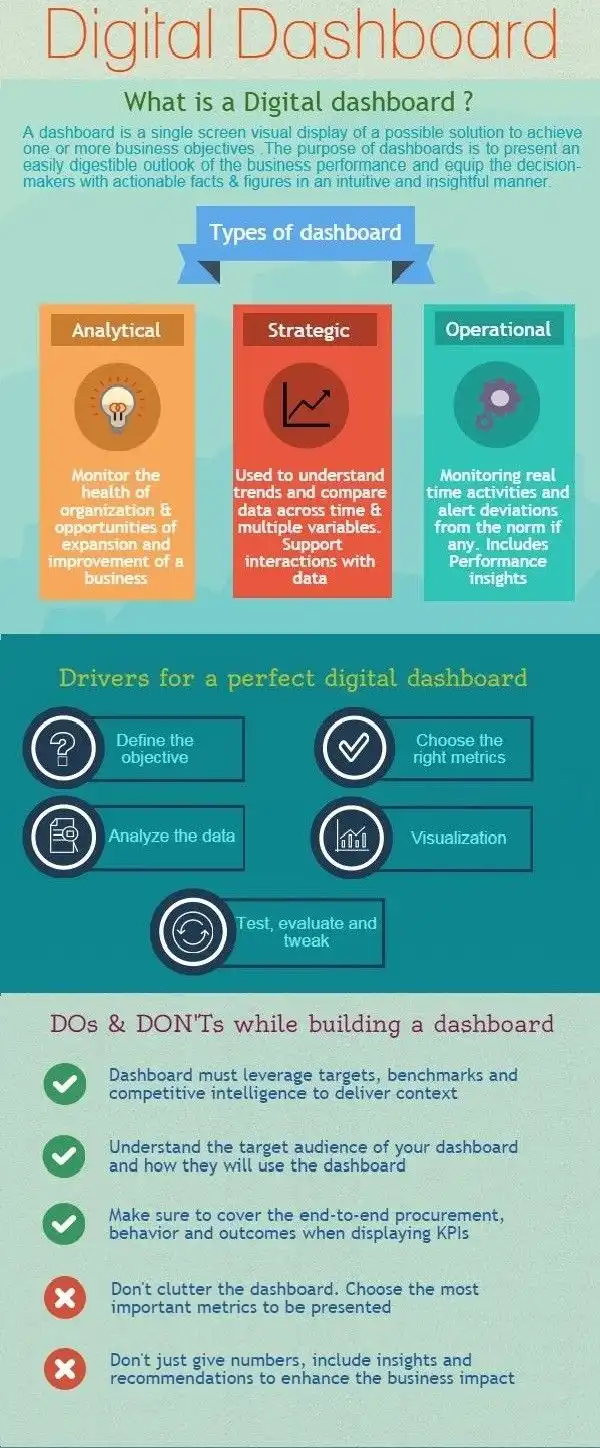
There are three types of **data analytics dashboards: operational, strategic, and analytical.
**
Operational: Operational analytics dashboards focus on the progress of work and show the current state of operations. Operational dashboards are real-time, are often used to understand where issues are, and are less often used for digging deeper into data.
Strategic: Strategic analytics dashboards display KPIs and clear, at-a-glance, digestible data visualizations. The focus is on showing simple trends and progress, obtaining immediate answers, and helping users monitor and understand if KPIs are on track.
Analytical: Analytical dashboards focus on flexibility and allowing the user to explore data points in as many ways as possible, through filters and comparisons, to reveal hidden insights. Common features include drilldowns, predictive models, and what-if parameters.
Every data analytics dashboard will look different depending on each different project’s goals and objectives. When done well, dashboards promote business transparency and provide a single source of truth. This has a trickle-down element where every single person in your company can see how their work impacts the business.