
There are several ways to create a visualization of a number line in Python. One way is to use the Matplotlib library, which is a powerful library for creating a variety of different types of plots and charts in Python. One of the best tools for interacting with visualizations is Jupyter Notebook. Make sure you have a recent version of python installed, and then install Jupyter:
pip install jupyter matplotlibNow you can start a notebook:
jupyter notebookTo create a simple number line using Matplotlib in Jupyter notebook:
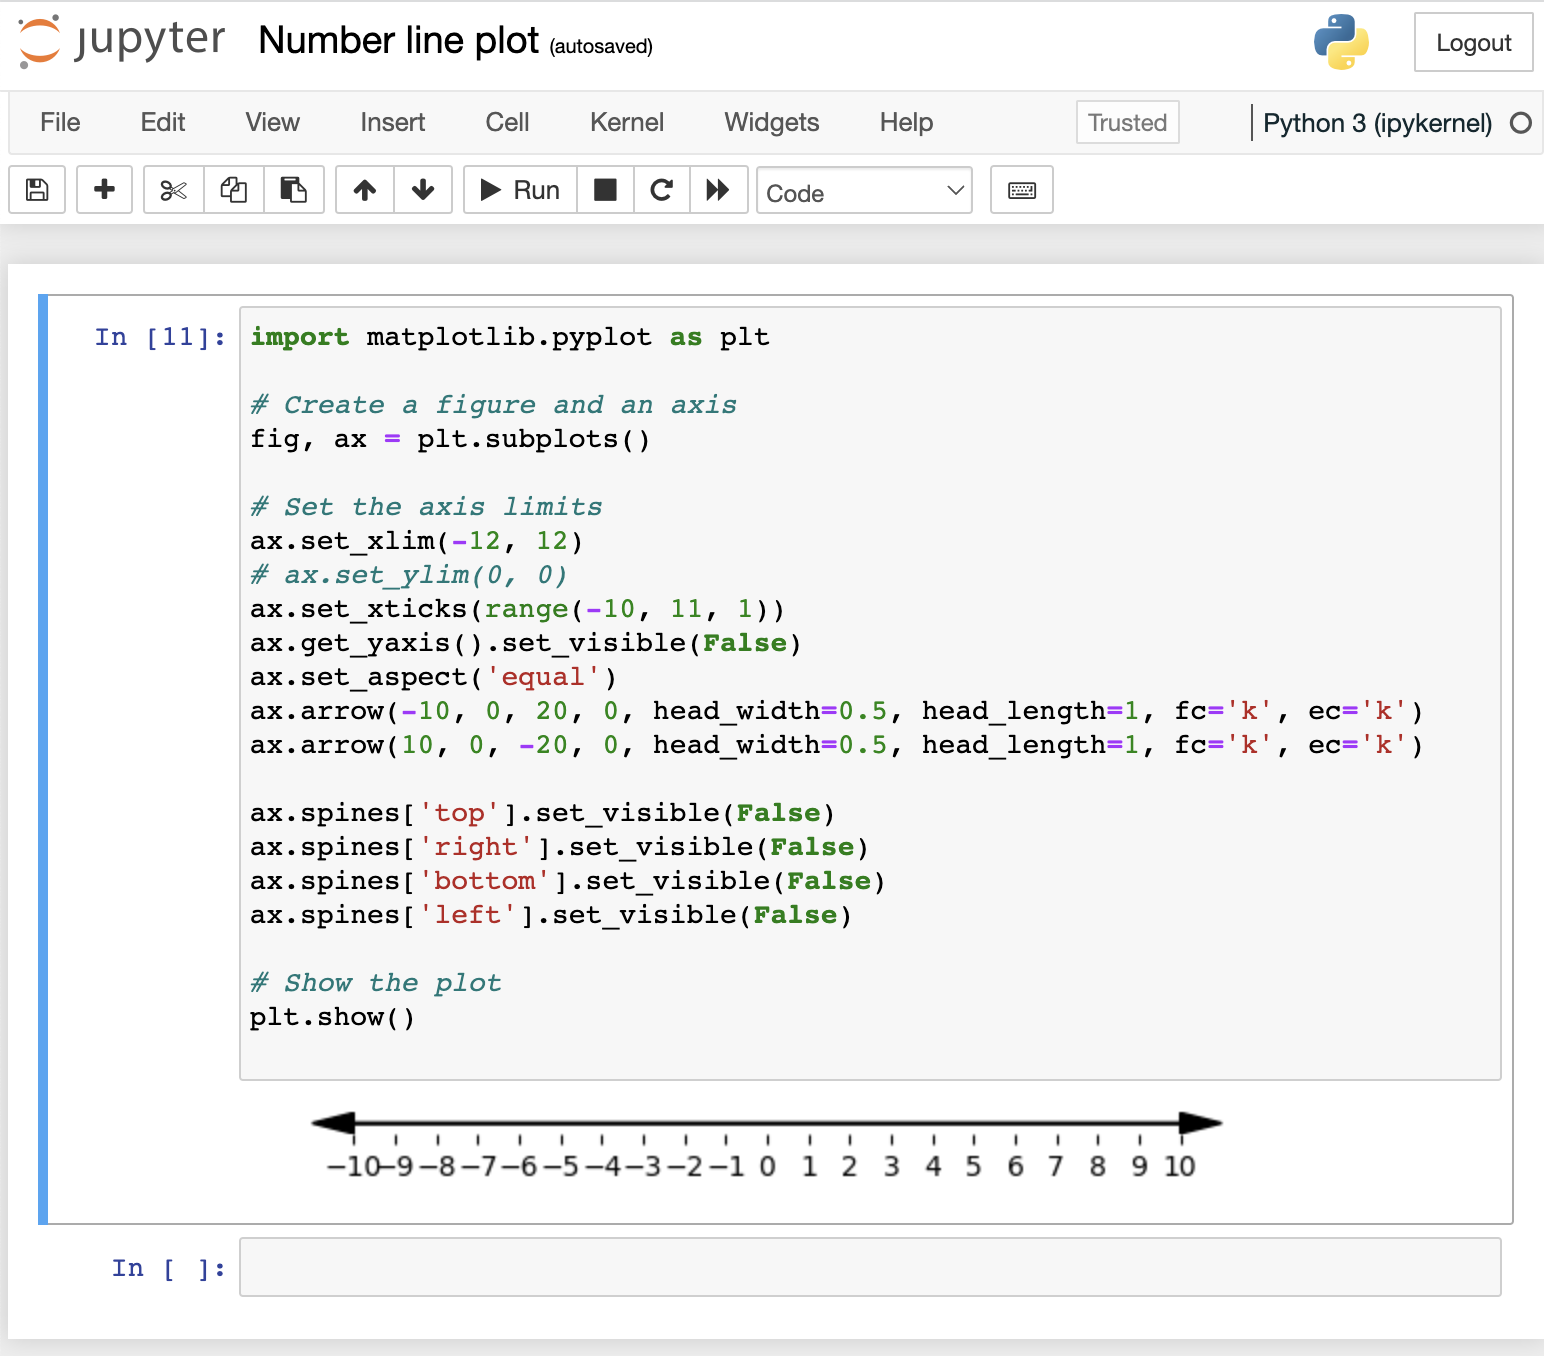
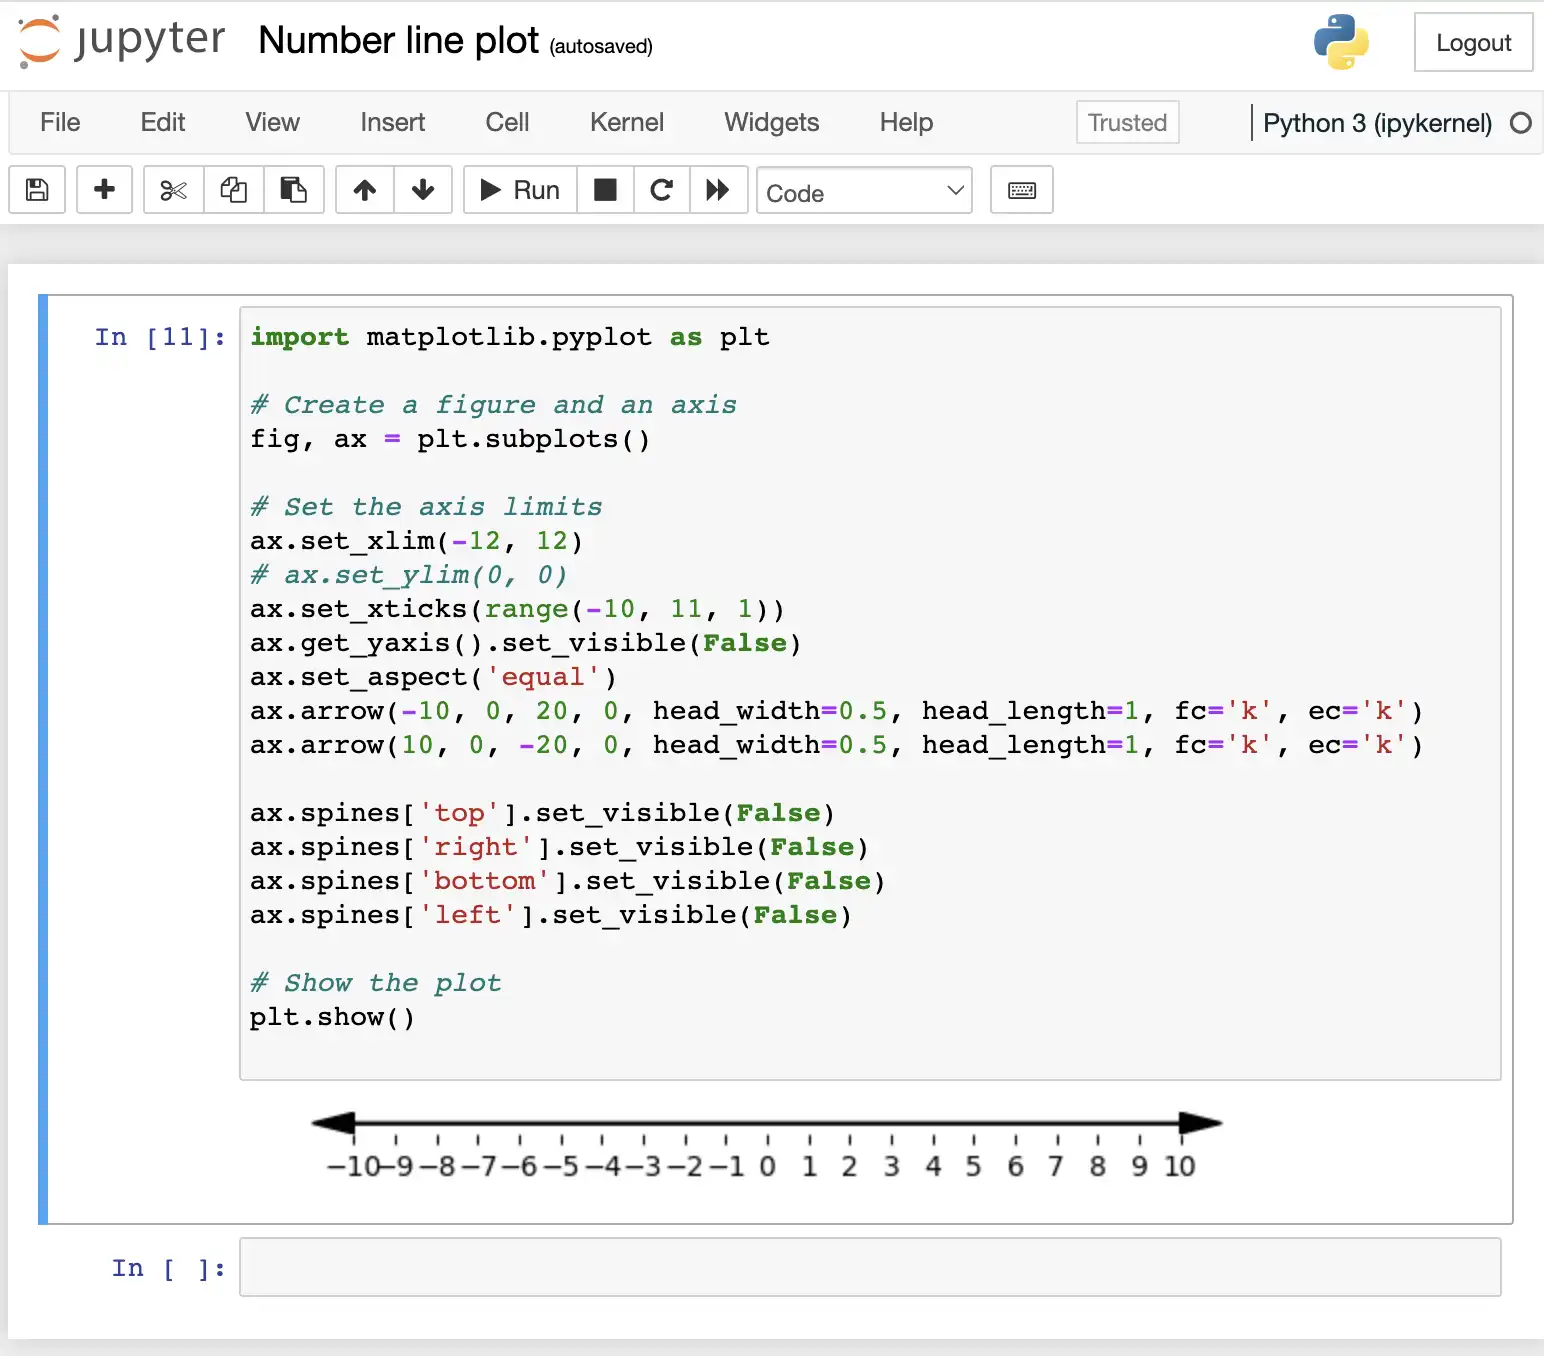
import matplotlib.pyplot as plt # Create a figure and an axisfig, ax = plt.subplots() # Set the axis limitsax.set_xlim(-12, 12)# Add the ticksax.set_xticks(range(-10, 11, 1)) # Remove y-axisax.get_yaxis().set_visible(False)# Center x-axisax.set_aspect('equal') # add arrowsax.arrow(-10, 0, 20, 0, head_width=0.5, head_length=1, fc='k', ec='k')ax.arrow(10, 0, -20, 0, head_width=0.5, head_length=1, fc='k', ec='k') # remove borderax.spines['top'].set_visible(False)ax.spines['right'].set_visible(False)ax.spines['bottom'].set_visible(False)ax.spines['left'].set_visible(False) # Show the plotplt.show()This code will create a figure with an x-axis that ranges from -10 to 10, and adds tick marks on each integer. You can customize the number line further by changing the axis limits, tick mark locations, and adding labels and other features.