
Introduction to Graph Theory
In graph theory, a graph is a collection of vertices (or nodes) and edges (or links) that connect pairs of vertices. Graphs are fundamental structures in computer science, mathematics, and other fields.
Definition of a Fully Connected Graph
A fully connected graph, also known as a complete graph, is a graph in which every pair of distinct vertices is connected by a unique edge. The complete graph with vertices is denoted by .
Examples of Fully Connected Graphs
- : A single vertex with no edges.
- : Two vertices with one edge connecting them.
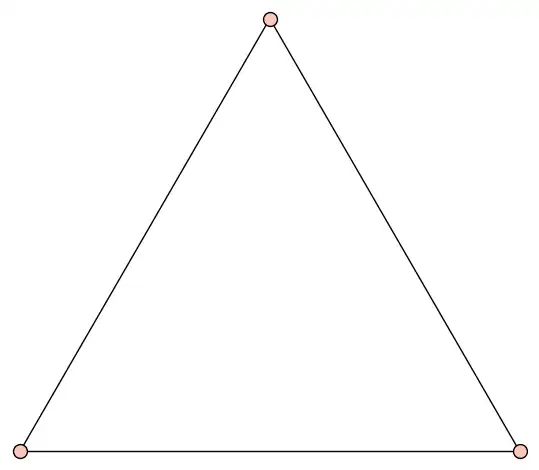
- : Three vertices, each connected to the other two, forming a triangle.
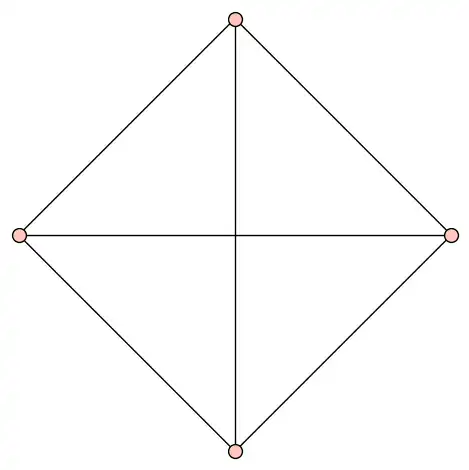
- : Four vertices, each connected to the other three, forming a tetrahedron.
Here are fully connected graphs from to :
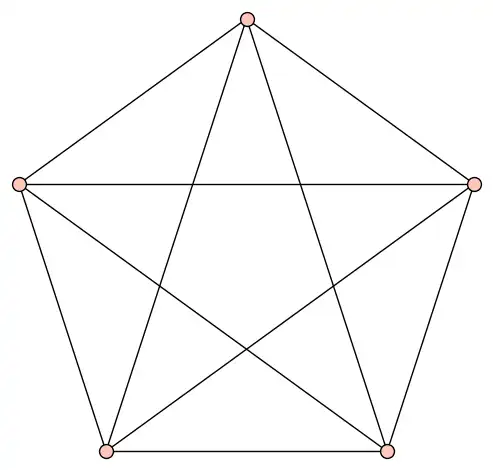
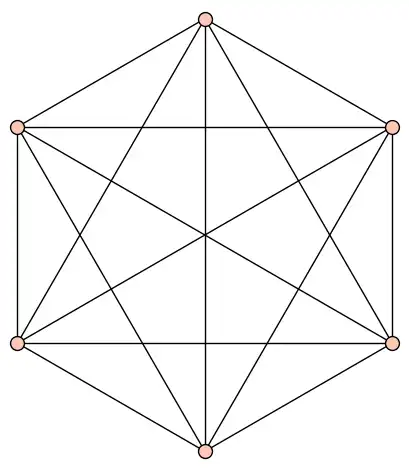
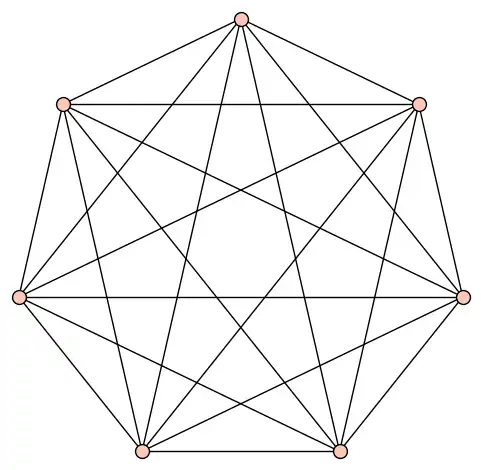
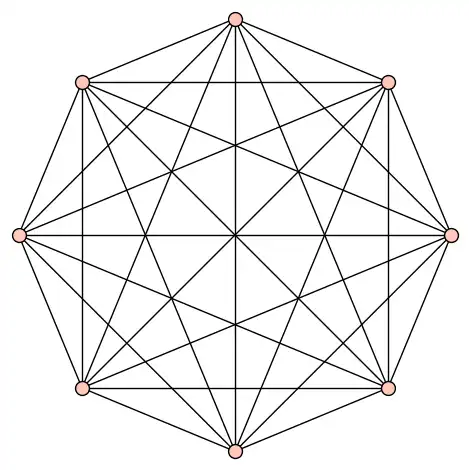
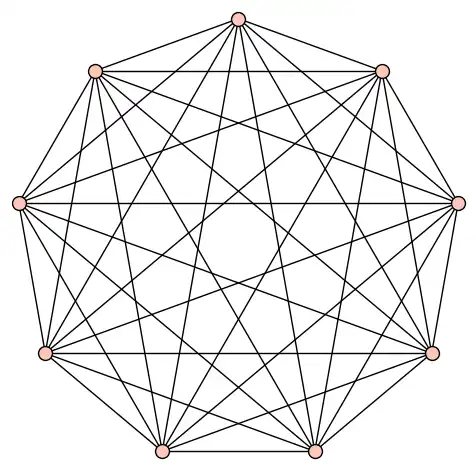
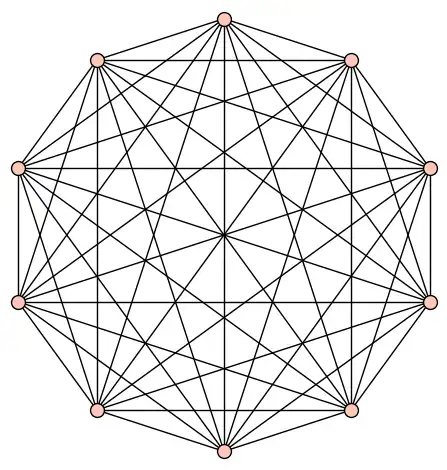
Visualizing Edges
The number of edges in a complete graph is given by the combinatorial formula , pronounced "n choose 2". This formula represents the number of ways to choose 2 vertices from vertices, which corresponds to the number of unique edges in the graph. This is "all possible unique pairs for a group." You could think of this as all the possible teams of 2 from the people in a classroom.
Calculation of n choose 2
The formula for is:
This formula can be derived from the basic principles of combinations, where we choose 2 vertices out of without regard to the order of selection.
Examples of Edge Calculations
For there are 3 edges:
$$ \binom{3}{2} = \frac{3 \cdot 2}{2} = 3 $$
For there are 6 edges:
$$ \binom{4}{2} = \frac{4 \cdot 3}{2} = 6 $$
Combinatorial Growth
As the number of vertices increases, the number of edges in grows rapidly. This growth is described as combinatorial or quadratic growth, which can be visualized using the parabolic function .
Graph of n choose 2
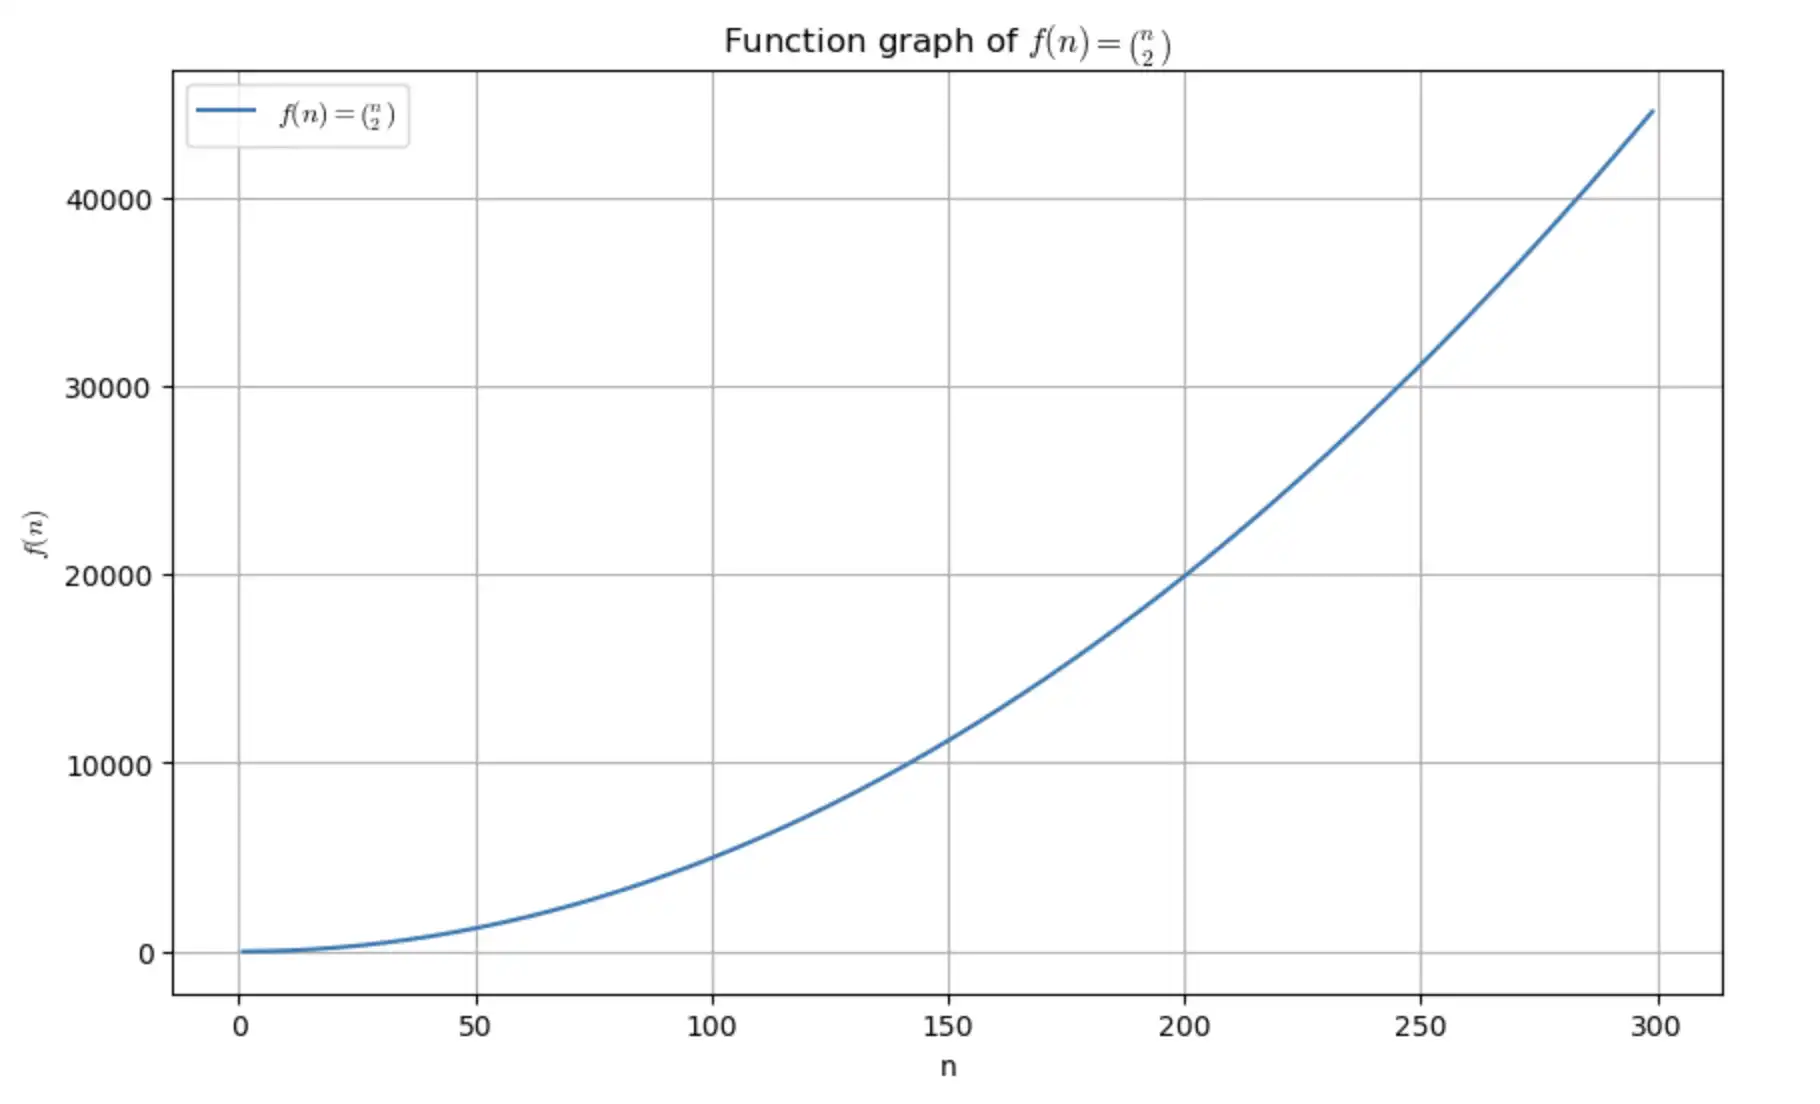
The graph of the function is a parabola, indicating that the number of edges increases much faster than the number of vertices.
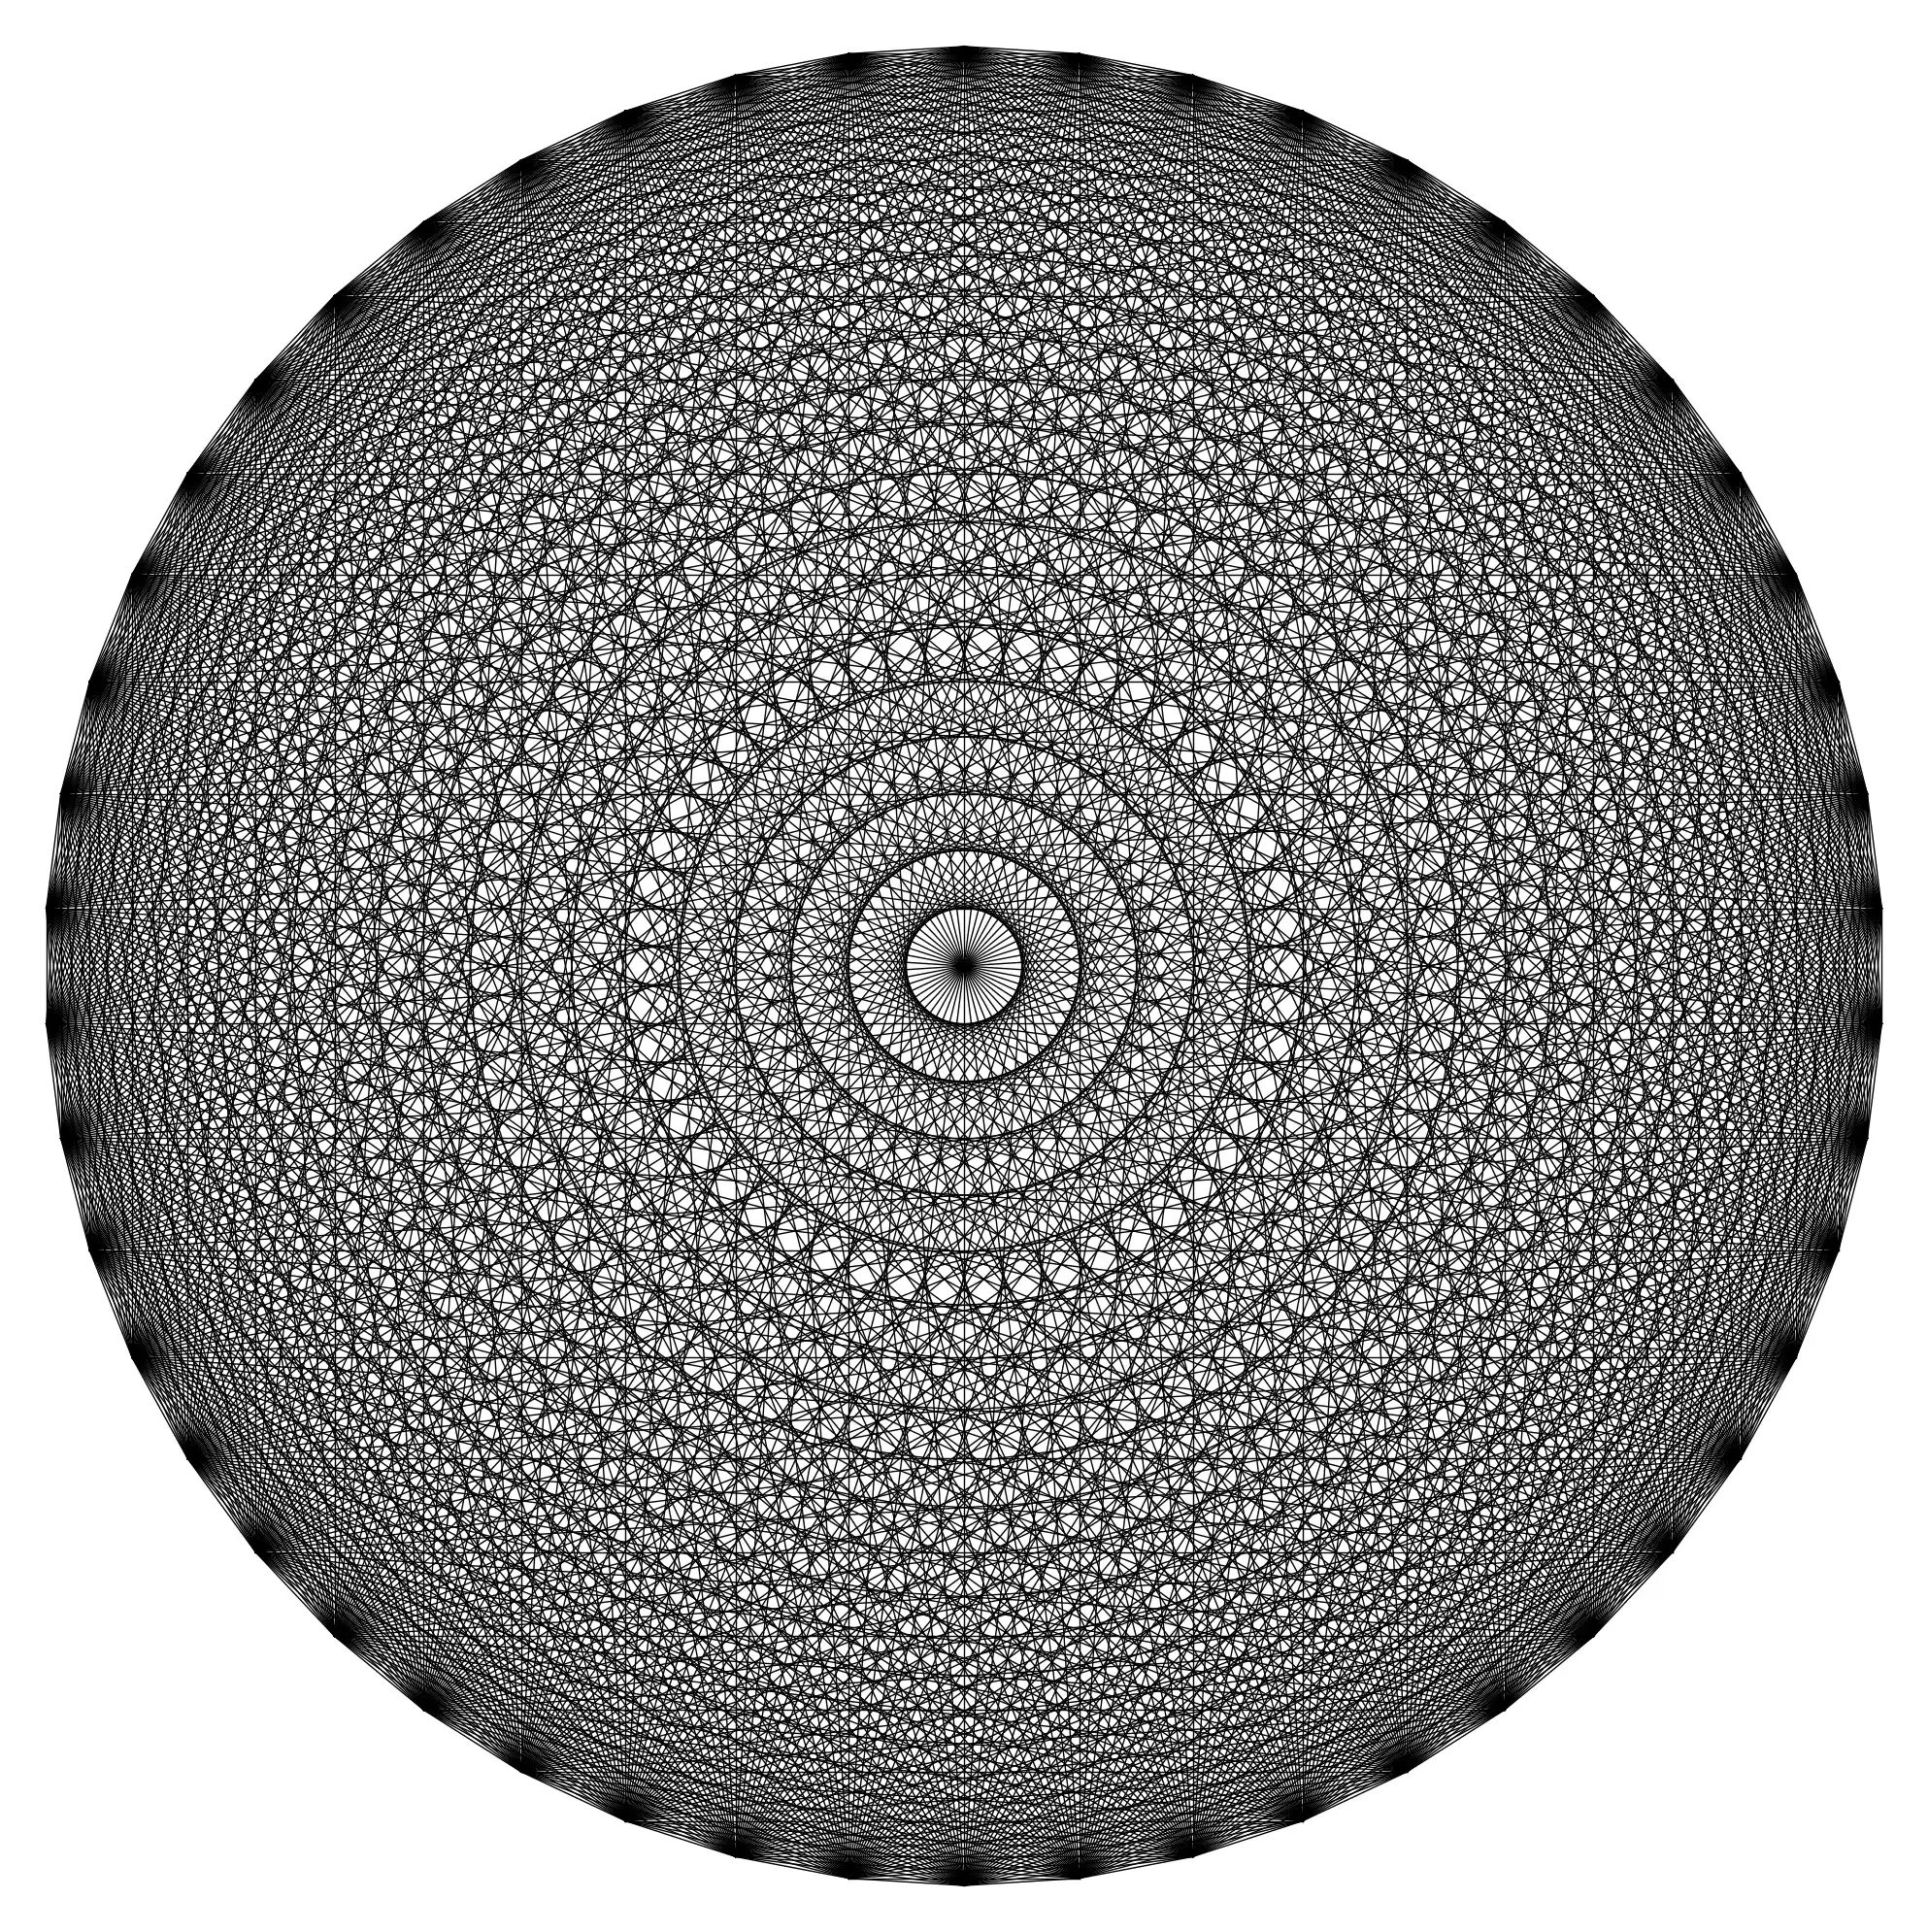
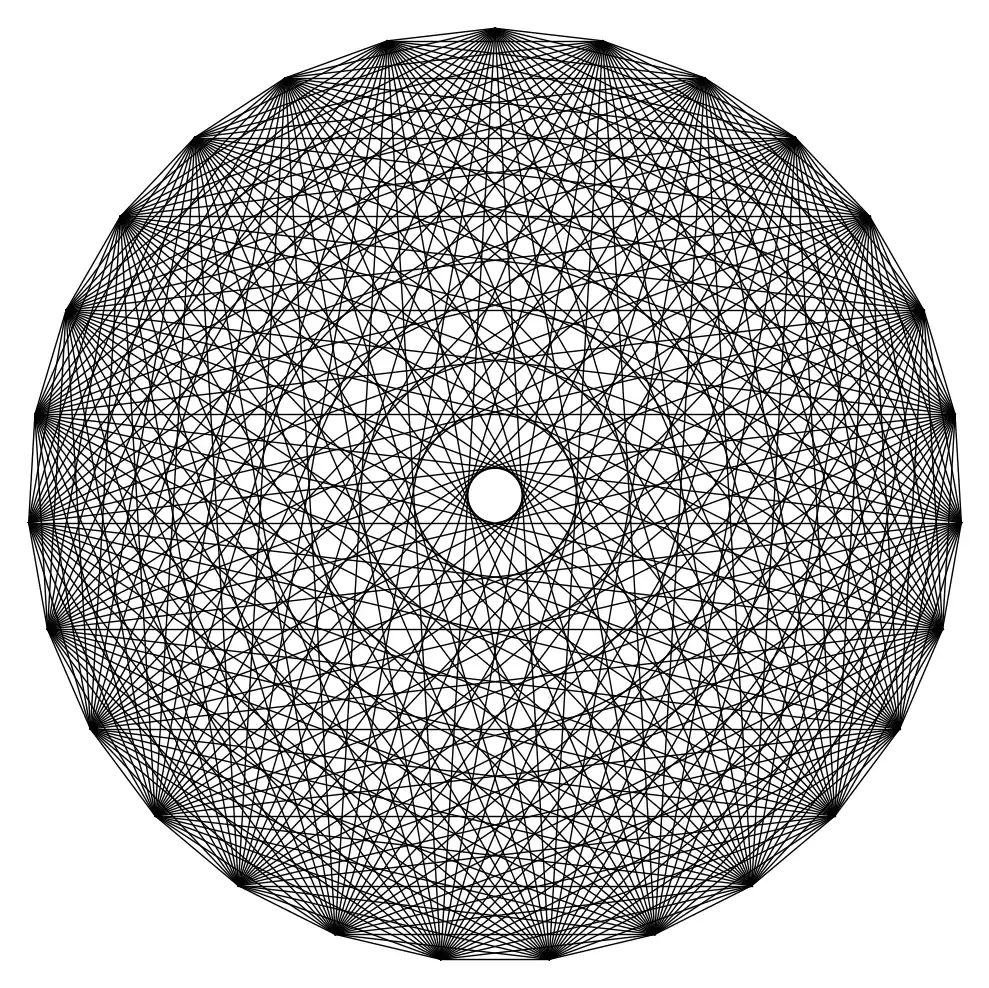
You can use https://www.sagemath.org/ to generate images of fully connected graphs with a lot of vertices.
G = graphs.CubeGraph(33)P = G.plot(vertex_labels=False, vertex_size=0, graph_border=True)P.show()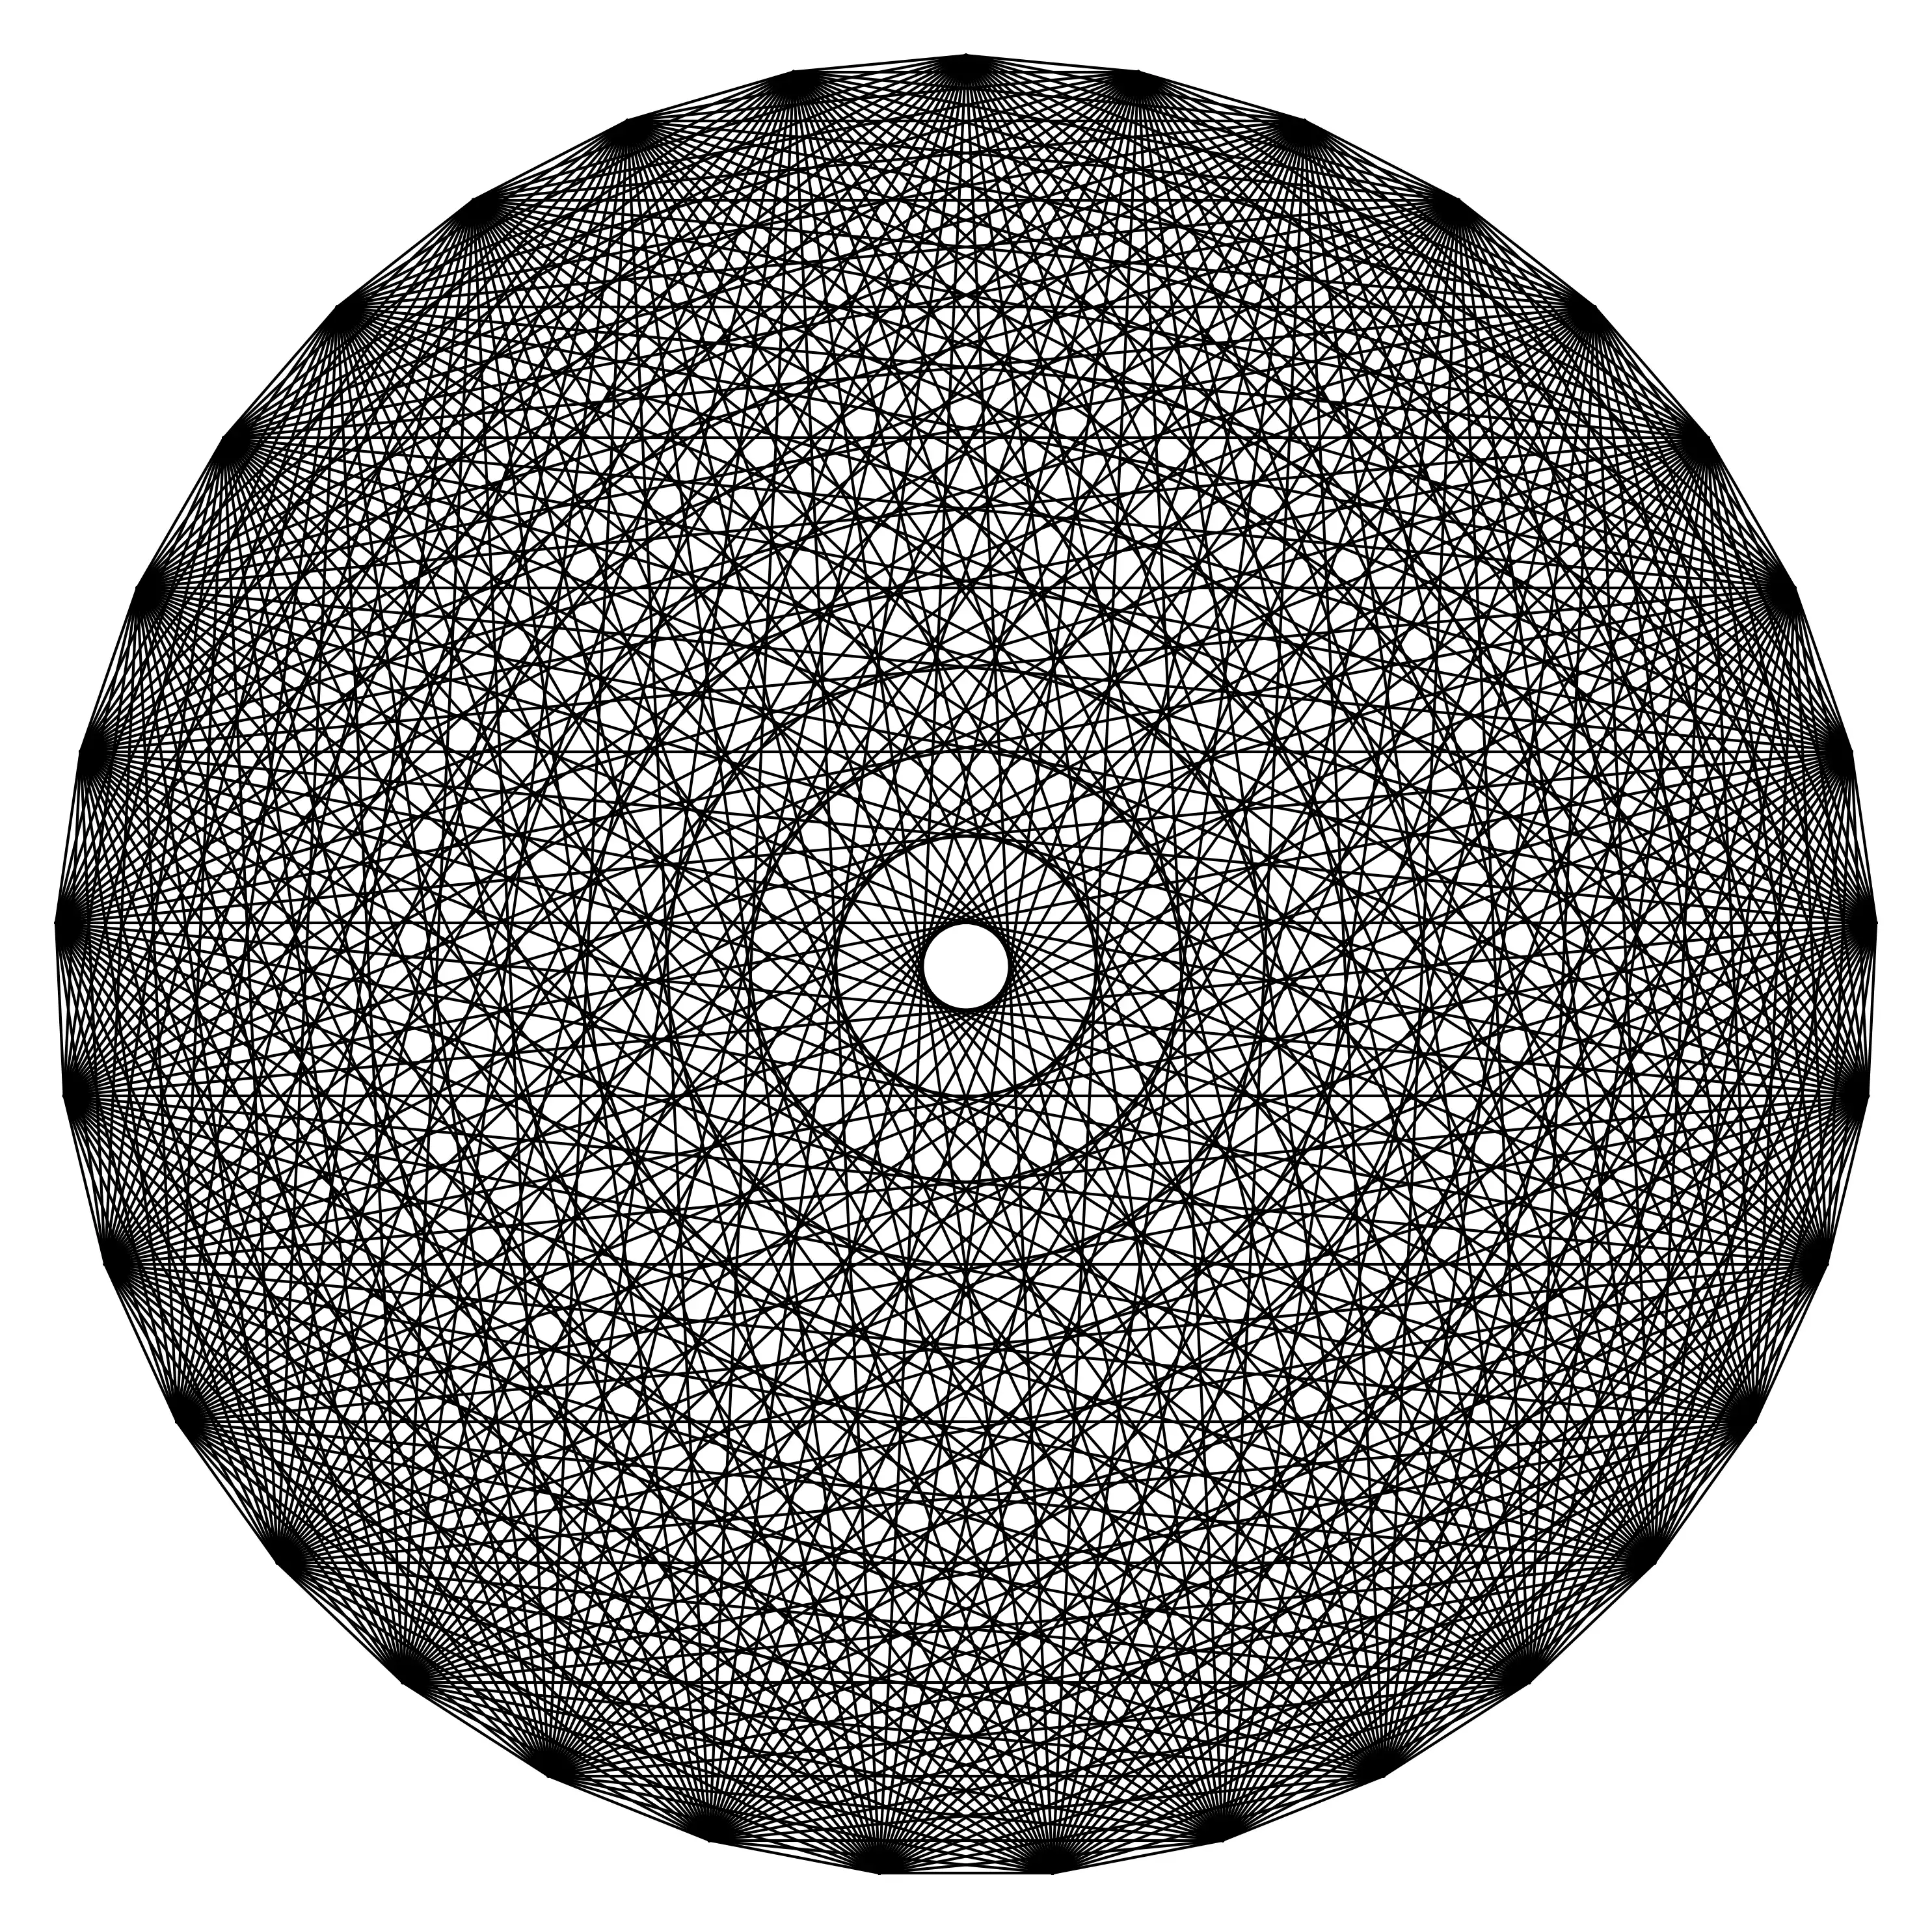
Formal Definition and Terminology
The rapid growth in the number of edges in a complete graph is formally known as quadratic growth due to the term in the formula for . This is distinct from exponential growth, where the growth rate would be proportional to a constant power of .
Conclusion
Fully connected graphs are fundamental in graph theory and combinatorics. Understanding their structure and the combinatorial growth of their edges helps in comprehending more complex graph-theoretic concepts. The visualization of these graphs, especially as increases, highlights the rapid increase in complexity, reinforcing the importance of combinatorial mathematics in various applications.
Further Reading
For more advanced studies, you can explore topics such as graph isomorphism, planar graphs, and applications of complete graphs in network theory and optimization problems.